Introduction
Hypothesis testing is a fundamental concept in statistics that helps us make informed decisions and draw conclusions about population parameters based on sample data. One essential tool in hypothesis testing is the Z-score, which quantifies how far a sample statistic is from the population parameter’s expected value. In this article, we will delve into the role of Z-scores in hypothesis testing, focusing on both one-sample Z-tests and two-sample Z-tests.
The Basics of Hypothesis Testing
What is Hypothesis Testing?
Hypothesis testing is a statistical method used to make inferences about population parameters by analyzing sample data. It involves formulating a null hypothesis (H0), which represents a specific claim or assumption about the population parameter, and an alternative hypothesis (Ha), which opposes or contradicts the null hypothesis. The goal is to determine whether there is enough evidence in the sample data to reject the null hypothesis in favor of the alternative hypothesis.
Z-Scores in Hypothesis Testing
Z-scores play a crucial role in hypothesis testing as they help us standardize sample statistics to compare them with population parameters. By converting sample data into Z-scores, we can assess how unusual or significant our observations are within the context of the null hypothesis.
One-Sample Z-Test
When to Use a One-Sample Z-Test?
A one-sample Z-test is appropriate when we want to determine whether a sample mean (X̄) is significantly different from a known population mean (μ) under the null hypothesis.
The Formula for One-Sample Z-Test
The formula for calculating the Z-score in a one-sample Z-test is:
Z = (X̄ – μ) / (σ / √n)
Where:
- Z is the Z-score.
- X̄ is the sample mean.
- μ is the population mean under the null hypothesis.
- σ is the population standard deviation.
- n is the sample size.
Steps in Conducting a One-Sample Z-Test
- Formulate the null hypothesis (H0) and the alternative hypothesis (Ha).
- Collect a random sample and calculate the sample mean (X̄) and sample standard deviation (s).
- Calculate the Z-score using the formula mentioned above.
- Determine the significance level (α), often set at 0.05.
- Compare the calculated Z-score to the critical Z-value from the standard normal distribution or use a Z-table to find the corresponding p-value.
- If the p-value is less than α, reject the null hypothesis; otherwise, fail to reject it.
Two-Sample Z-Test
When to Use a Two-Sample Z-Test?
A two-sample Z-test is employed when we want to compare the means of two independent samples to assess whether they are significantly different from each other. It is commonly used in situations where we have two treatment groups or two distinct populations.
The Formula for Two-Sample Z-Test
The formula for calculating the Z-score in a two-sample Z-test is:
Z = (X̄1 – X̄2) / √((σ1^2 / n1) + (σ2^2 / n2))
Where:
- Z is the Z-score.
- X̄1 is the mean of the first sample.
- X̄2 is the mean of the second sample.
- σ1 is the standard deviation of the first sample.
- σ2 is the standard deviation of the second sample.
- n1 is the sample size of the first sample.
- n2 is the sample size of the second sample.
Steps in Conducting a Two-Sample Z-Test
- Formulate the null hypothesis (H0) and the alternative hypothesis (Ha).
- Collect two independent random samples and calculate their respective means (X̄1 and X̄2) and standard deviations (σ1 and σ2).
- Calculate the Z-score using the formula mentioned above.
- Determine the significance level (α).
- Compare the calculated Z-score to the critical Z-value or find the corresponding p-value.
- If the p-value is less than α, reject the null hypothesis; otherwise, fail to reject it.
Interpreting Z-Scores in Hypothesis Testing
Critical Values and P-Values
In both one-sample and two-sample Z-tests, the decision to reject or fail to reject the null hypothesis depends on comparing the Z-score to critical values from the standard normal distribution or calculating the p-value. If the Z-score falls in the rejection region (beyond the critical value) or the p-value is less than the chosen significance level (α), we reject the null hypothesis.
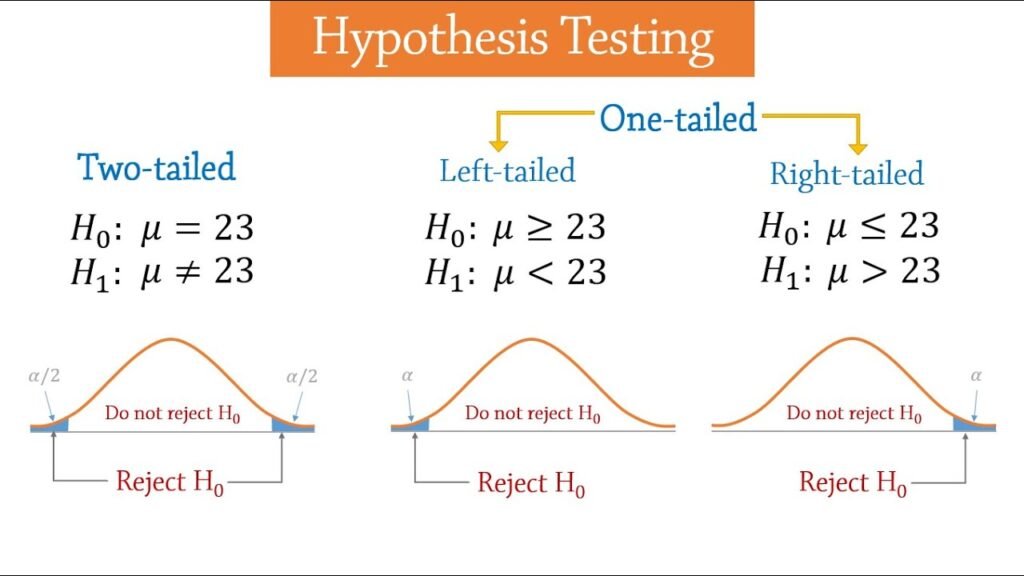
Direction of the Test
The direction of the test (one-tailed or two-tailed) is determined by the research question and the alternative hypothesis. A one-tailed test checks for significance in one direction (greater than or less than), while a two-tailed test checks for significance in both directions.
Real-World Applications of Z-Scores in Hypothesis Testing
Medical Research
In medical research, Z-scores are used to compare the effectiveness of different treatments. Researchers may conduct two-sample Z-tests to determine whether a new drug has a statistically significant impact on patient outcomes compared to a standard treatment.
Quality Control
Manufacturing industries use Z-scores in hypothesis testing to maintain quality standards. For example, a company may perform a one-sample Z-test to determine if the mean weight of a product batch matches the target weight.
Education
In education, Z-scores help assess the effectiveness of teaching methods. Researchers may use one-sample Z-tests to determine if a new teaching approach leads to significantly better test scores compared to traditional methods.
Finance
In finance, Z-scores are employed to evaluate the financial health of companies. A low Z-score may indicate a higher risk of bankruptcy, prompting investors and analysts to take precautions.
Conclusion
Z-scores are invaluable tools in hypothesis testing, allowing us to assess the significance of sample statistics in relation to population parameters. Whether conducting one-sample Z-tests to compare a sample mean to a known population mean or two-sample Z-tests to compare means of independent samples, understanding the role of Z-scores in hypothesis testing is essential for making informed decisions and drawing meaningful conclusions from data.
These tests have numerous real-world applications in fields such as medical research, quality control, education, and finance, making them indispensable tools for researchers, analysts, and decision-makers.