- Enter the Raw Score, Mean (μ), and Standard Deviation (σ) for your data.
- Click "Calculate Z-Score" to calculate the Z-Score and related values.
- Results, including the Z-Score, p-values, and confidence level, will be displayed below.
- Calculation steps will also be shown to explain how the Z-Score was computed.
- A chart visualizes the Z-Score in the context of the normal distribution.
- You can clear the entries, copy the results, and view calculation history.
Introduction
The Z Score Calculator is a valuable statistical tool used in various fields, from finance to healthcare and education. It helps us understand the relative position of a data point within a data set and allows for meaningful comparisons across different distributions. In this article, we will explore the concept of Z scores, the formulae involved, example calculations, real-world use cases, and conclude with the significance of this statistical tool.
The Concept of Z Score
What is a Z Score?
A Z score, also known as a standard score or a z-value, quantifies how many standard deviations a data point is away from the mean (average) of a data set. It provides a standardized way to assess the relative position of a data point within a distribution. A positive Z score indicates that the data point is above the mean, while a negative Z score suggests that it is below the mean.

Formula for Z Score
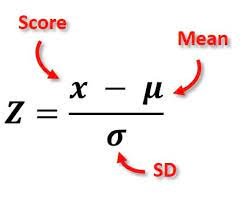
The formula for calculating the Z score of a data point X in a data set with mean μ and standard deviation σ is:
Z = (X – μ) / σ
Where:
- Z is the Z score.
- X is the data point.
- μ is the mean of the data set.
- σ is the standard deviation of the data set.
Example Calculations
Let’s illustrate the calculation of Z scores with a simple example:
Suppose we have a dataset of exam scores for a class with a mean (μ) of 75 and a standard deviation (σ) of 10. If a student scored 85 on the exam, we can calculate the Z score as follows:
Z = (85 – 75) / 10 = 1
In this case, the Z score is 1, indicating that the student’s score is 1 standard deviation above the mean.
Real-World Use Cases
Finance
Z scores play a crucial role in finance, particularly in assessing the creditworthiness of individuals and companies. Credit scoring models often use Z scores to evaluate the risk of default on loans or bonds. A lower Z score suggests a higher risk of default, while a higher Z score indicates a lower risk.
Healthcare
In healthcare, Z scores are used to assess a patient’s growth and development, especially in pediatrics. Pediatricians use Z scores to compare a child’s height, weight, or other measurements to a standardized growth chart, helping identify any potential growth-related issues.
Quality Control
Manufacturing industries rely on Z scores for quality control purposes. By monitoring the Z scores of product specifications, companies can ensure that their products consistently meet quality standards. Deviations from the mean beyond a certain threshold may indicate defects or production issues.
Education
In the field of education, Z scores are often used to evaluate the performance of students in standardized tests. Z score analysis helps educators identify whether a student’s performance is significantly different from their peers, accounting for variations in test difficulty.
Conclusion
The Z Score Calculator is a versatile tool that finds applications across various domains. By quantifying the relative position of data points within a distribution, Z scores allow for standardized comparisons and informed decision-making. Whether in finance, healthcare, quality control, or education, understanding Z scores empowers professionals to make data-driven choices.
In conclusion, the Z Score Calculator is a fundamental statistical tool that enhances our ability to interpret and utilize data effectively. Its simplicity and utility make it a valuable asset in the toolbox of analysts, researchers, and decision-makers in a wide range of fields.
References
- Altman, E. I. (1968). Financial Ratios, Discriminant Analysis, and the Prediction of Corporate Bankruptcy. Journal of Finance, 23(4), 589-609.
- Kuczmarski, R. J., Ogden, C. L., Grummer-Strawn, L. M., Flegal, K. M., Guo, S. S., Wei, R., … & Johnson, C. L. (2000). CDC growth charts: United States. Advance Data, 314, 1-27.
- Montgomery, D. C. (2017). Introduction to statistical quality control. John Wiley & Sons.